
The Flight Deck enables you to choose the management information which you wish to view or monitor.
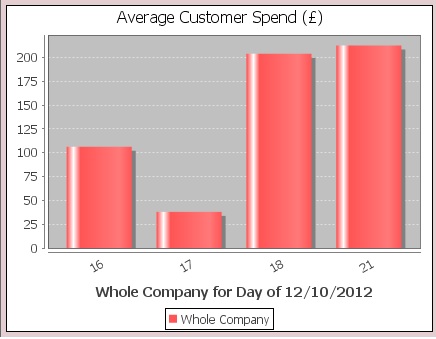
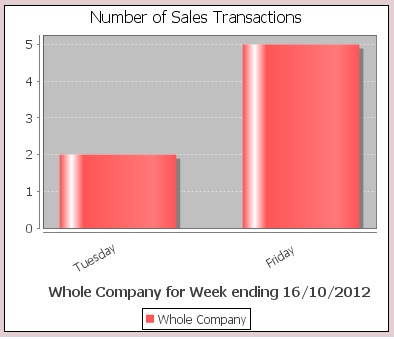
Average Customer Spend, Sales Revenue, Gross Profit, Number of Sales Transactions, Number of Products Sold, Top Articles, and Top Suppliers can all be seen in the Back Office in Connect.
The Flight Deck window is divided into four sections to enable you to look at four different types of management information.
How to access the Flight Deck
From the Back Office click on the ‘Flight Deck’ icon.

This will open the Flight Deck window. On initial use of this window all four sections of the window will be blank.
Note: Once you have used this window and revisit it, it will contain your last set of management information viewed.
[su_divider]
How to Create a View of Management Information
Select the management information you want to view from the drop down list in the ‘What’ field.
Note: The management information is displayed in a graphical view unless ‘Top Articles’ or ‘Top Suppliers’ are selected. This information is shown as a list.
![]()
From the ‘When’ dropdown list choose a time period by which you wish to view the management information.
![]()
The drop down calendar enables you to define a time period to end on. Click on the drop down on the ‘to’ field to select the date.
![]()
The ‘Who’ field enables you to choose a particular store, website or all sites on which to view the information. Click on the drop down to make your selection.
![]()
Once you have chosen from all the fields, click on the arrow icon on the left to run the report.
![]()
The information requested will now appear in the section selected within the ‘Flight Deck’ window.
Follow the same steps with differing combinations to complete all four sections of the Flight Deck window.
Note: The graphs can be saved or printed by right clicking on the chosen graph and selecting ‘Save as. . .’ or ‘Print. . .’ as applicable.
It is not possible to save or print the ‘Top Articles’ or ‘Top Suppliers’ list.
[su_divider]
How to Change the Graphical View and Appearance of the Management Information
By default all management information shown in a graphical format will be shown as a bar graph. If you would like to change this view select the chart you want to change by clicking on it.
Note: The background of the chart will be highlighted in pink so you know when it has been selected.
Click on the curved arrow in the top left hand corner of the window to change the graphical view to a 3-D Bar Graph if required.
![]()
The arrow can be clicked again to change the view to another graph.
Note: Each time the curved arrow is clicked, the graphical views changes. This is changed through from a Bar Graph to 3D Bar Graph, Area Line Graph, Pie Chart and then back to Bar Graph.
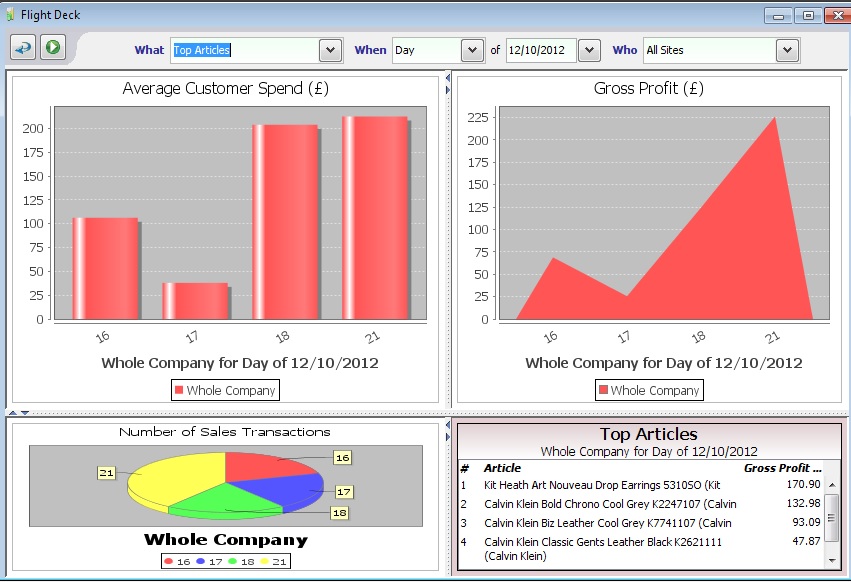
The Flight Deck is divided into four windows. This can be altered by clicking on the arrows between the graphs to extend the windows for alternative views. The opposing arrow can be clicked to revert back to the original view.
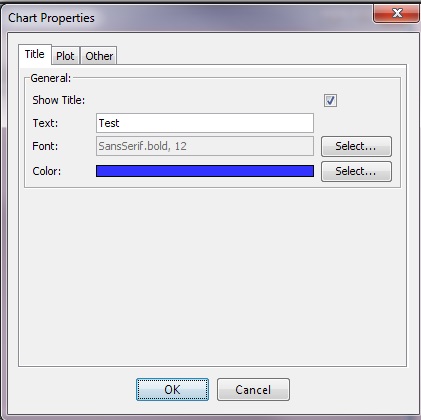
The Title, labels and backgrounds of the graphs can be edited in the ‘Chart Properties’ window. Right click on the graph and select ‘Properties’ to access this. Once any amendments have been made click ‘OK’ for the changes to take effect.
Note: it is not possible to make any amendments to the ‘Top Articles’ or ‘Top Suppliers’ lists.
[su_divider]