
This document describes where to find the reports icon, how to use the reporting functionality and how best to select data on which to run reports.
[su_divider]
Where To Find Reports
The reporting functionality is available from all but one window within the Back Office and a number of windows via the ALU button on the till. Data can be selected to report on at group level or at individual article level.
Open a window within the Back Office of Connect e.g. Suppliers.
Click on the reports button.
![]()
The reports pop up window will appear.
[su_divider]
Report Window Sections
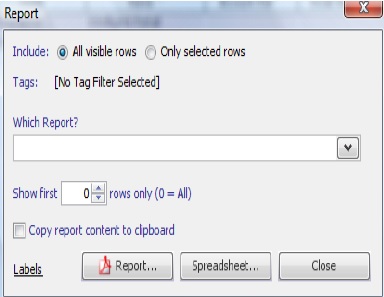
The Reports window has multiple sections which need to be completed to enable you to bespoke the information that you require.
Include
At the top of the window there are two radio buttons:
![]()
- All Visible Rows – all rows shown within the window
- Only Selected Rows – row, group or article highlighted.
By default All Visible Rows radio button is selected. By clicking on the radio button to the left of each label enables you to identify which data within your selected window you wish to report on.
Tags
This section will show any tags already selected as a filter within the window you have active e.g. Stock, Customers, Suppliers.
![]()
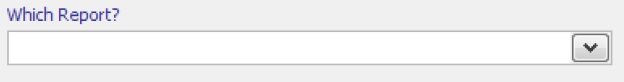
Which Report
Click on the down arrow to the right of this field and choose a required report from the drop down list.
Show First
In some instances you will only require a certain number of results from a report. This field enables you to specify the number of results you wish to see by entering a number. E.g. Top ten suppliers rather than a report showing all suppliers.
![]()
Checkbox
This checkbox enables you to copy the results of the report to the clipboard within Microsoft Windows so that you can paste the data into another application.
![]()
When you have chosen a particular report type in the Which Report field the report pop up window will expand
to include some or all of the further options listed below to choose from:
Which Date Period
A number of radio buttons enable you to choose a date period within which you can analyse your chosen data.
- This Financial year
- Last Financial year
- This Month (default)
- Last Month
- Today
- Yesterday
- Specific Date Range
By clicking on the radio button to the left of each label enables you to identify which date range you wish to report on.
If the radio button labelled Specific Date Range is chosen two time period fields will appear labelled ‘From’ and ‘To’.
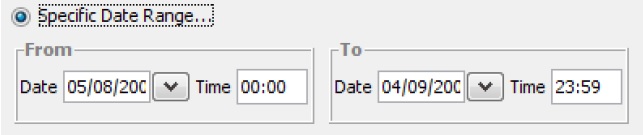
Either enter the date using DD/MM/YYYY format or choose a date from the calendar by clicking on the down arrow to the right of each date field. Enter the time using HH:MM format.
Which Location
There are two fields one labelled Site and the other labelled Till.
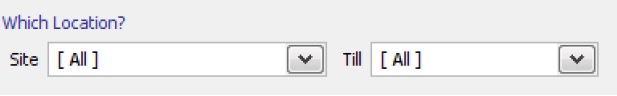
These fields enable you to choose particular Sites/Tills on which to report on. Click on the down arrow to the right of each field and choose from the drop down list.
Which Sort Order
This field enables you to choose a particular sort order by which you can view the results of your report.
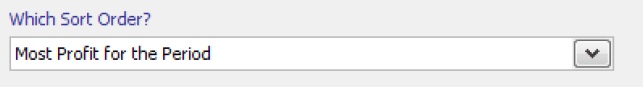
Click on the down arrow to the right of this field and choose an alternative sort order to the default.
[su_divider]
How To Run a Report
Reports can be presented in two formats: Adobe Acrobat (.pdf) and Spreadsheet
Identify the data on which to run the report.
See following section on selecting data.
Click on the report button
Select required options. See above section.
Choose the format for report results
![]()
[su_divider]
How To Select Data For Reporting
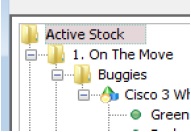
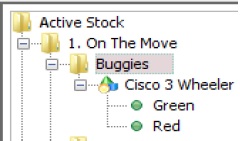
Active Stock Window
Reporting on the Whole Stock Tree
Click on the Active Stock label at the top of the stock tree and then click on the reports button. Reports will be executed on all articles within the stock tree.
Reporting on a Group or Sub Group
Click on a particular Group or Sub Group and click on the report button. Ensure that you select the radio button labelled Only Selected Rows. Reports will be executed on all articles within the Group or Sub Group Highlighted in the Stock Tree.
Reporting on a particular Supplier
Click on the down arrow to the left of the Suppliers Filter and choose a supplier from the drop down list.
![]()
The stock tree will now only show articles which are purchased from that chosen supplier. Click on the report button. Reports will be executed on all articles shown in the stock tree.
Reporting on a selection of articles using filters.
Enter your chosen word in the filter field and press the enter key. The stock tree will now only show articles which have that word within their description.
![]()
Click on the report button.
Reporting on a selection of articles using Hot Lists
Select a Hot List and click on the report button. Ensure that you select the radio button labelled Only Selected Rows. Reports will be executed on all articles identified within the Hot List.
Reporting on a selection of data using Tags.
Click on the Tags Filter, and select the tags that you wish to report on.
![]()
Click on the report button. Reports will be executed on all articles applied to the chosen tag(s).
[su_divider]
Supplier/Customer Window
Reporting on the Whole Supplier / Customer List
Click on the report button. Reports will be executed on all Suppliers/Customers.
Reporting on a particular Supplier/Customer
Click on a particular Supplier/Customer. Click on the report button. Ensure that you select the radio button labelled Only Selected Rows. Reports will be executed only on the selected Supplier/Customer.
Reporting using Tags
Click on the Tags Filter, and select the tags that you wish to report on.
![]()
Click on the report button. Reports will be executed on all Suppliers/Customers applied to the chosen tag(s).
[su_divider]
Report Content
The following information details the headings shown within each report and the possible sort orders that can be selected.
Reports are continually being written and updated. The following detail was available at the point of publication.
[su_divider]
Staff Report
Sales by Staff
Headings:
- Site
- Operator
- Number of Transactions
- Number of Articles Sold
- Amount (incl. VAT)
- Amount (excl. VAT)
- Average Customer Spend
- Scheme Discounts Amount
- Manual Discounts Amount
Sort Order:
- Site (default)
- Staff Member
[su_divider]
Customer Reports
CRM Activity Sheet
(page per customer)
Headings:
- Customer Name and Address Details
- Account Ref No
- Customer Demographics
- Activities for Customer
Sort Order:
- Natural Order
Customer Account Invoices – All
Headings:
- Customer Name & Address
- Account Ref No
- Document Ref
- Category
- Article Code
- Description
- Quantity
- Qty Price
- Sub Total
- Carriage
- Total
- Paid To Date
- Amount Due
- Value of VAT
(Each invoice shown individually)
Sort Order:
- Customer Name (Default)
- Invoice Date
Customer Account Invoices – Unpaid Only
Headings:
- Customer Name & Address
- Account Ref No
- Document Ref
- Category
- Article Code
- Description
- Quantity
- Qty Price
- Sub Total
- Carriage
- Total
- Paid To Date
- Amount Due
- Value of VAT
(Each invoice shown individually)
Sort Order:
- Customer Name (Default)
- Invoice Date
Customer Account Invoices with VAT Detail – All
Headings:
- Customer Name & Address
- Account Ref No
- Document Ref
- Article Code
- Description
- Unit Price
- VAT Rate (%)
- Quantity
- Qty Price
- Sub Total
- Carriage
- Total
- Paid To Date
- Amount Due
- Value of VAT
(Each invoice shown individually)
Sort Order:
- Customer Name (Default)
- Invoice Date
Customer Account Invoices with VAT detail – Unpaid Only
Headings:
- Customer Name & Address
- Account Ref No
- Document Ref
- Article Code
- Description
- Unit Price
- VAT Rate (%)
- Quantity
- Qty Price
- Sub Total
- Carriage
- Total
- Paid To Date
- Amount Due
- Value of VAT
(Each invoice shown individually)
Sort Order:
- Customer Name (Default)
- Invoice Date
Customer Account Statement
(each transaction shown row by row)
Headings:
- Customer Name & Address
- Account Ref No
- Credit Terms
- Date of receipt/invoice
- Reference No. Receipt/Invoice
- Details of Sale
- Outstanding Monies
- Amount Due
- Aged Debt Analysis
Sort Order:
- Customer Name (Default)
- Account Balance
- Geographical Area
- Overdue Balance
Customer Sales Detail
(Each transaction shown individually)
Headings:
- Customer Name
- Email Address
- County
- Postcode
- Transaction Date
- Number of Articles
- Amount (inc. VAT)
- Amount (excl. VAT)
- Discount
Sort Order:
- Customer Name (Default)
- Email Address
- Geographical Area
- Highest Number of Transactions
- Highest Total Spend
Customers Sales Summary
(Cummulated figures by Customer)
Headings:
- Customer
- Email Address
- County
- Post Code
- Number or Transactions
- Number of Articles
- Amount (incl. VAT)
- Amount (excl. VAT)
- Average Customer Spend
- Discount
Sort Order:
- Customer Name (Default)
- Email Address
- Geographical Area
- Highest Number of Transactions
- Highest Total Spend
[su_divider]
Supplier Reports
Average Customer Spend by Supplier
(Cummulative figures by Supplier)
Headings:
- Supplier Code
- Supplier Name
- Current Year – Number of Transactions
- Current Year – Total Nett Spend (£)
- Current Year – Average Nett Spend (£)
- Previous Year – Number of Transactions
- Previous Year – Total Nett Spend (£)
- Previous Year – Average Nett Spend (£)
- Average Nett Customer Spend – Current Year over Previous Year (Split into months)
Sort Order:
- Highest Average Spend (Default)
- Supplier
Supplier League Table
(Cummulative figures by Supplier)
Headings:
- Supplier Code
- Supplier Name
- Number of Items Sold
- Sales incl. VAT (£)
- Sales excl. VAT (£)
- Purchase Code (£)
- Gross Profit (£)
- Discounts Given (£)
- Achieved Markup
- Average Days in Stock
- Average Sales per Day in Stock
- Average Gross Profit per Day in Stock (£)
- Contribution to Company Profit (%)
Sort Order:
- Most Profit for the Period (Default)
- Fastest Moving Items
- Most Profitable per Day
- Most Revenue for the Period
- Natural Order
- Supplier Name
[su_divider]
Stock Reports
Allocated Stock Report
Headings:
Article Code
Article Description
Receipt Number
Quantity
Retail Value
Sort Order:
Article Code (Default)
Article Description
Receipt Number
Article League Table
(Cummulated figures by Article)
Headings:
- Article Code
- Description
- Number of Items Sold
- Sales incl. VAT (£)
- Sales excl. VAT (£)
- Purchase Cost (£)
- Gross Profit (£)
- Discounts Given(£)
- Archived Markup
- Days in Stock
- Average Sales per Day in Stock
- Average Gross Profit per Day in Stock (£)
- Contribution to Company Profit (£)
Sort Order:
- Most Profit for the Period (Default)
- Fastest Moving
- Most Items Sold
- Most Profitable per Day
- Most Revenue for the Period
Article Listing
Headings:
- Supplier
- Suppliers Group
- Suppliers Code
- Our Code
- Retail Price (£)
- Article Description
Sort Order:
- Natural Order (Default)
- Article Description
- Supplier
Article Sales Report – 12 Months Purchases over Sales
(cummulated figures by article)
Headings:
- Our Code
- Supplier Code
- In Stock
- Number of Days in Stock
- Average Sales per Day in Stock
- Average Gross Profit per Day in Stock (£)
- Contribution to Company Profit (%)
- Trade Price (£)
- Retail Price (£)
- Markup
- Sales for Period
- Purchases over Sales (split by months)
Sort Order:
- Most Sales for the Period (Default)
- Fastest Moving
- Highest Markup
- Most Profitable Article
- Supplier then Fastest Moving
- Supplier then Highest Markup
- Supplier then Most Profitable Article
- Supplier then Most Sales for the Period
Article Sales Report – Summary by Category
(Cummulated figures by top level categories)
Headings:
- Classification
- Number of Items Sold
- Sales incl. VAT (£)
- Sales excl. VAT (£)
- Purchase Cost (£)
- Gross Profit (£)
- Discounts Given (£)
- Achieved Markup
- Average Days in Stock
- Average Sales per Day in Stock
- Average Gross Profit per Day in Stock (£)
- Contribution to Company Profit (£)
Sort Order:
- Natural Order (Default)
- Fastest Moving Items
- Most Items Sold
- Most Profit for the Period
- Most Profitable per Day
- Most revenue for the Period
- Supplier Name
Average Customer Spend Report – Summary by Category
Headings:
- Classification
- Current Year – Number of Transactions
- Current Year – Total Nett Spend (£)
- Current Year – Average Nett Spend (£)
- Previous Year – Number of Transactions
- Previous Year – Total Nett Spend (£)
- Previous Year – Average Nett Spend (£)
- Average Nett Customer Spend – Current Year over Previous Year (split by months)
Sort Order:
- Natural Order (Default)
- Highest Average Spend
- Supplier
Bank Reconciliation Report
Headings:
- Date
- Cash and Cheques (£)
- Cards (£)
- Internet Card Sales (£)
- Cash and Cheque Corrections (£)
- Card Corrections (£)
- Internet Card Corrections (£)
- Total Cash and Cheques (£) – after corrections
- Total Cards (£) – after corrections
- Total Internet Cards (£) – after corrections
- Total (£)
Sort Order:
- Date Order
Customer Product List
Headings:
- Order Ref
- Date
- Customer Name
- Address
- County
- Post Code
- Region
- Telephone Number
- Product Code
- Description
- Stock Quantity
- Order Status
Sort Order:
- Customer, Product Code (Default)
- Order Status, Customer, Product Code
- Product Code, Customer
- Transaction Date, Product Code
Customer Sales List
Headings:
- Customer
- Post Code
- Telephone Number
- Order Ref
- Date
- Product Code
- Product Description
- Quantity
- Serial Number
Sort Order:
- Product Code
- Customer (Default)
Customers Awaiting Products
Headings:
- Order Ref
- Customer Name
- Address
- County
- Post Code
- Region
- Telephone Number
- Product Code
- Description
- Stock Quantity
Sort Order:
- Product Code, Description (Default)
- Customer, Product Code
- Product Code, Receipt
- Receipt, Product Code
Form – Article Stocktake
Headings:
- Supplier
- Suppliers Group Code
- Suppliers Article Code
- Our Article Code
- Article Description
- Retail Price
- In Stock
- Shop
- Store Room
- Window
Sort Order:
- Natural Order (Default)
- Article Description
- Supplier then Supplier Group Code
Form – Shop Floor Replenishment
Headings:
- Supplier
- Suppliers Group Code
- Suppliers Article Code
- Our Article Code
- Article Description
- Retail Price
- In Stock
- Verify
- Sales
Sort Order:
- Natural Order (Default)
- Article Description
- Fastest Moving
- Supplier
Pricing – Price Export Sheet (spreadsheet only)
Headings:
- !us:vendor_article_id
- Us:vendor_article_code
- Us:short_description
- Vendor:vendor_description
- Our_supplier:price
- Us:price
- Margin (%)
Sort Order:
- Article Description
- Company Price
- Largest Margin
- Article Code (Default)
Pricing – Margin Report
Headings:
- Article Code
- Article Description
- Supplier
- Supplier Price
- Retail Price
- Margin (%)
Sort Order:
- Article Description
- Company Price
- Largest Margin
- Article Code (Default)
Pricing – Site Override Report
Headings:
- Date
- Site
- Article Code
- Article Description
- Supplier
- Company Price
- Site Price
- Difference (%)
- +/-
Sort Order:
- Article Code
- Article Description
- Company Price
- Date
- Largest Price Difference
- Site
- Site Price
- Site then Price Difference (Default)
Replenishment Report – Place Order Detail
Headings:
- Supplier
- Your Group
- Your Code
- Your Re-order Code
- Our Code
- Article Description
- In Stock
- Minimum Pack Size
- Recent Monthly Sale Frequency
- Trade Price
- Recommended Order Quantity
- Quantity Price
Sort Order:
- Supplier then Vendor Article Code (Default)
- Supplier then Our Article Code
Replenishment Report by Article
Headings:
- Your Barcode
- Your Code
- Your Reorder Code
- Our Code
- Last Order Price
- In Stock
- Reorder Level
- Recent Daily Sales Frequency
- Gross Profit per Day in Store (£)
- Estimated Days to Reorder Level
- Minimum Pack Size
- Purchases over Sales (split by month)
Sort Order:
- Most Urgent Replenishment Required (Default)
- Fastest Moving
- Supplier then Fastest Moving Articles
- Supplier then Most Urgent Replenishment Required
Replenishment Report by Supplier
Headings:
- Supplier
- Number of Active Stock Lines
- Average Gross Profit per Day in Store (£)
- Percentage Require Reorder Now
- Require Reorder Now
- Require Reorder in 7 Days
- Require Reorder in 1 Month
- Require Reorder in 2 Months
- Require Reorder in 3 Months
- Minimum Pack Size Not Set
- Trade Price Not Set
- Carriage Charged
- Carriage Paid
- Cost of Carriage
- Approx. Order Value – 1 Months Stock
- Approx. Order Value – 2 Months Stock
- Approx. Order Value – 3 Months Stock
- Approx. Order Value – 4 Months Stock
- Approx. Order Value – 5 Months Stock
- Approx. Order Value – 6 Months Stock
Sort Order:
- Most Urgent Replenishment Required (Default)
- Most Profitable Stock Lines
- Most Stock Lines
- Supplier
Stock Holding – Summary by Category
Headings:
- Classification
- Quantity in Stock
- Purchase Value excl. VAT (£)
- Purchase VAT (£)
- Purchase Value incl. VAT (£)
- Sales Value excl. VAT (£)
- Sales VAT (£)
- Sales Value incl. VAT (£)
- Average Markup
Sort Order:
- Natural Order (Default)
- Markup
- Purchase Value
- Sales Value
Stock Movement Report
Headings:
- Movement Date
- Movement Reason
- Product Code
- Product Description
- Site
- Staff Member
- Receipt Ref
- Quantity Accepted
- Quantity Rejected
- Total Quantity
- Retail Value incl. VAT (£)
- Purchase Cost exc. VAT (£)
Sort Order:
- Movement Date (Default)
- Product Code, Movement Date
- Product Code, Reason
- Reason, Movement Date
- Reason, Product Code
Stock Take Variance Report
Headings:
- Stock Take Date
- Our Code
- Supplier Code
- Product Description
- Site
- Staff Member
- Stock Take Qty
- Previous Qty
- Total Variant Qty
- Retail Value (inc. VAT)
- Purchase Cost (excl. VAT)
Sort Order:
- Stock Take Date (Default)
- Total Variant Quantity
Supplier League Table
Headings:
- Supplier Code
- Supplier Name
- Number of Items Sold
- Sales incl. VAT (£)
- Sales (£)
- Purchase Cost (£)
- Gross Profit (£)
- Discounts Given (£)
- Achieved Markup
- Average Days in Stock
- Average Sales per Day in Stock
- Average Gross Profit per Day in Stock (£)
- Contribution to Company Profit (£)
Sort Order:
- Most Profit for the Period (Default)
- Fastest Moving Items
- Most Items Sold
- Most Profitable per Day
- Most Revenue for the Period
- Natural Order
- Supplier Name
Supplier Letter – Damages on Goods-In
Headings:
- Customer Name and Address Details
- Account Reference
- Date
- Our Code
- Your Group
- Your Code
- Your Re-order Code
- Article Description
- Quantity
- Replacement Required
Sort Order:
- Supplier then Supplier Article Code (default)
- Supplier then Our Article Code
Supplier Letter – Place Order
Headings:
- Suppliers Name and Address Details
- Account Reference
- Date
- Our Code
- Your Code
- Your Re-order Code
- Article Description
- Minimum Pack Size
- Quantity
Sort Order:
- Supplier then Most Profitable Article per Day (Default)
- Supplier then Our Article Code
- Supplier then Suppliers Article Code
Supplier Letter – Request for Stock Images
Headings:
- Suppliers Name and Address Details
- Account References
- Date
- Our Code
- Your Group
- Your Code
- Your Re-order Code
- Article Description
Sort Order:
- Supplier then Vendor Article Code (Default)
- Supplier then Our Article Code
Tag League Table
Headings:
- Tag Set
- Tag Description
- Number of Items Sold
- Sales +VAT (£)
- Sales (£)
- Purchase Cost (£)
- Gross Profit (£)
- Discounts Given (£)
- Achieved Markup
- Margin (%)
- Days In Stock
- Av. Sales Per Day In Stock
- Av. Gross Profit Per Day In Stock
- Contribution To Company Profit (%)
Sort Order:
- Most Profit for the Period (Default)
- Fastest Moving
- Most Items Sold
- Most Profitable per Day
- Most Revenue for the Period
[su_divider]